
Update 18/07/2017: BSoD reported with nVidia drivers WHQL (dated 29/06/2017) to me (in French) and fixed by applying Asus’ drivers. See conclusion.
If we ever have to speak about the looks, the form factor and the cooling system, I’d have to say that I love the Asus ROG (Republic of Gamers) laptop G750JM.
But it has issues. It actually has a number of issues you can’t overlook.
Technical specification
Its specs are not the best, but good enough to be able to run multiple VMs, the Witcher 3 and enjoying desktop like performance on just about any tasks. Not high-end desktop like performance, but not far from it.
- CPU: Intel i7 4700HQ 2.4GHz;
- RAM: 16GB;
- GPU: NVIDIA GTX 860M (2GB);
- Storage: 1To Hitachi Travelstar 7K1000;
- Windows 8.1 Pro 64bits.
For the operating system I have installed my own license of Windows 8.1, just to make sure I don’t have to live with the bloat it comes with. No overclocking was involved at any moment, it’s still a laptop so I’d like to maximize its lifespan.
Blue Screen of Death: DRIVER_POWER_STATE_FAILURE 0x9F
Ever since I have owned this laptop, I remember having systematic Blue Screens of Death (DRIVER_POWER_STATE_FAILURE) when Geforce Experience was installed and Shadow Play was enabled at startup. I have since then removed Geforce Experience to not experience any BSoDs at startup.
I never go to understand the issue. I have since then never installed Shadow Play ever again, and I actually would like to be able to record gaming footage…
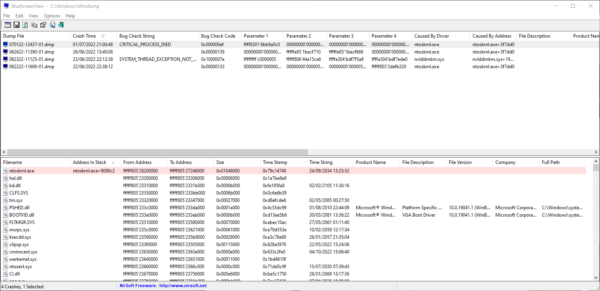
But recently I have been experiencing those BSoDs again. Strange since I didn’t update the NVidia driver in a long time (version 353.06). I could take a look at a crash dump.
The good thing about running into issues is that it’s the perfect time to learn stuff such as using WinDbg. With just a few commands I can find out what went wrong… Or get to close to know.
This is the debugging process:
*******************************************************************************
*                                                                             *
*                        Bugcheck Analysis                                    *
*                                                                             *
*******************************************************************************

Use !analyze -v to get detailed debugging information.

BugCheck 9F, {3, ffffe000e61bd060, ffffd0011789c960, ffffe000e546a010}

Probably caused by : pci.sys

Followup: MachineOwner
---------

2: kd> k
Child-SP          RetAddr           Call Site
ffffd001`1789c928 fffff802`a4e92782 nt!KeBugCheckEx
ffffd001`1789c930 fffff802`a4e926a2 nt!PopIrpWatchdogBugcheck+0xde
ffffd001`1789c990 fffff802`a4d302d8 nt!PopIrpWatchdog+0x32
ffffd001`1789c9e0 fffff802`a4dde7ea nt!KiRetireDpcList+0x4f8
ffffd001`1789cc60 00000000`00000000 nt!KiIdleLoop+0x5a
2: kd> !analyze -v
*******************************************************************************
*                                                                             *
*                        Bugcheck Analysis                                    *
*                                                                             *
*******************************************************************************

DRIVER_POWER_STATE_FAILURE (9f)
A driver has failed to complete a power IRP within a specific time.
Arguments:
Arg1: 0000000000000003, A device object has been blocking an Irp for too long a time
Arg2: ffffe000e61bd060, Physical Device Object of the stack
Arg3: ffffd0011789c960, nt!TRIAGE_9F_POWER on Win7 and higher, otherwise the Functional Device Object of the stack
Arg4: ffffe000e546a010, The blocked IRP

Debugging Details:
------------------


DRVPOWERSTATE_SUBCODE:  3

IMAGE_NAME:  pci.sys

DEBUG_FLR_IMAGE_TIMESTAMP:  53d0f1d4

MODULE_NAME: pci

FAULTING_MODULE: fffff80107fae000 pci

DEFAULT_BUCKET_ID:  WIN8_DRIVER_FAULT

BUGCHECK_STR:  0x9F

PROCESS_NAME:  System

CURRENT_IRQL:  2

ANALYSIS_VERSION: 6.3.9600.17237 (debuggers(dbg).140716-0327) amd64fre

DPC_STACK_BASE:  FFFFD001178A3FB0

STACK_TEXT:
ffffd001`1789c928 fffff802`a4e92782 : 00000000`0000009f 00000000`00000003 ffffe000`e61bd060 ffffd001`1789c960 : nt!KeBugCheckEx
ffffd001`1789c930 fffff802`a4e926a2 : ffffe000`e546af08 00000000`00000001 ffffe000`ea7417e0 fffff802`a4d2e391 : nt!PopIrpWatchdogBugcheck+0xde
ffffd001`1789c990 fffff802`a4d302d8 : 00000000`00000000 ffffd001`1789cae0 00000000`00000001 00000000`00000001 : nt!PopIrpWatchdog+0x32
ffffd001`1789c9e0 fffff802`a4dde7ea : ffffd001`17872180 ffffd001`17872180 ffffd001`1787e3c0 ffffe000`ed531080 : nt!KiRetireDpcList+0x4f8
ffffd001`1789cc60 00000000`00000000 : ffffd001`1789d000 ffffd001`17897000 00000000`00000000 00000000`00000000 : nt!KiIdleLoop+0x5a


STACK_COMMAND:  kb

FOLLOWUP_NAME:  MachineOwner

IMAGE_VERSION:  6.3.9600.17238

FAILURE_BUCKET_ID:  0x9F_3_ACPI_IMAGE_pci.sys

BUCKET_ID:  0x9F_3_ACPI_IMAGE_pci.sys

ANALYSIS_SOURCE:  KM

FAILURE_ID_HASH_STRING:  km:0x9f_3_acpi_image_pci.sys

FAILURE_ID_HASH:  {20ddeb92-07eb-ebdc-bd08-44da71ffbd68}

Followup: MachineOwner
---------

2: kd> !irp ffffe000e546a010
Irp is active with 6 stacks 4 is current (= 0xffffe000e546a1b8)
 No Mdl: No System Buffer: Thread 00000000:  Irp stack trace.
     cmd  flg cl Device   File     Completion-Context
 [  0, 0]   0  0 00000000 00000000 00000000-00000000

      Args: 00000000 00000000 00000000 00000000
 [  0, 0]   0  0 00000000 00000000 00000000-00000000

      Args: 00000000 00000000 00000000 00000000
 [  0, 0]   0  0 00000000 00000000 00000000-00000000

      Args: 00000000 00000000 00000000 00000000
>[ 16, 2]   0 e1 ffffe000e61b1240 00000000 fffff80107fb3b30-ffffe000e61ff730 Success Error Cancel pending
         \Driver\ACPI	pci!PciBusPowerUpCompletion
      Args: 00000000 00000001 00000001 00000000
 [ 16, 2]   0 e1 ffffe000e61ff5e0 00000000 fffff802a4da91cc-ffffe000e546af08 Success Error Cancel pending
         \Driver\pci	nt!PopRequestCompletion
      Args: 00000000 00000001 00000001 00000000
 [  0, 0]   0  0 00000000 00000000 00000000-ffffe000e546af08

      Args: 00000000 00000000 00000000 00000000
I get to understand a few things from it:
- Line 11:
pci.sys might have caused the BSoD;
- Line 33 & 34: A physical device object blocked an IRP for too long;
- Line 36: The block IRP.
What’s actually interesting is the line 36: ffffe000e546a010. At line 91 I run a command with that IRP number:
2: kd> !irp ffffe000e546a010
Irp is active with 6 stacks 4 is current (= 0xffffe000e546a1b8)
 No Mdl: No System Buffer: Thread 00000000:  Irp stack trace.
     cmd  flg cl Device   File     Completion-Context
 [  0, 0]   0  0 00000000 00000000 00000000-00000000

      Args: 00000000 00000000 00000000 00000000
 [  0, 0]   0  0 00000000 00000000 00000000-00000000

      Args: 00000000 00000000 00000000 00000000
 [  0, 0]   0  0 00000000 00000000 00000000-00000000

      Args: 00000000 00000000 00000000 00000000
>[ 16, 2]   0 e1 ffffe000e61b1240 00000000 fffff80107fb3b30-ffffe000e61ff730 Success Error Cancel pending
         \Driver\ACPI	pci!PciBusPowerUpCompletion
      Args: 00000000 00000001 00000001 00000000
 [ 16, 2]   0 e1 ffffe000e61ff5e0 00000000 fffff802a4da91cc-ffffe000e546af08 Success Error Cancel pending
         \Driver\pci	nt!PopRequestCompletion
      Args: 00000000 00000001 00000001 00000000
 [  0, 0]   0  0 00000000 00000000 00000000-ffffe000e546af08

      Args: 00000000 00000000 00000000 00000000
The entry that is marked is the one on the line 14. It mentions on line 51 that IRP’s driver is \Driver\ACPI. ACPI is what puts some components to sleep and does status monitoring. What could possibly be the issue and how is it related to Nvidia ?
I don’t know. Reports on the internet have pointed at some feature called Turbomaster being the culprit. Disabling it in the UEFI should fix the issue according to reports from people online. It did not for me.
Let’s check the most recent BSoD:
*******************************************************************************
*                                                                             *
*                        Bugcheck Analysis                                    *
*                                                                             *
*******************************************************************************

Use !analyze -v to get detailed debugging information.

BugCheck 9F, {3, ffffe000842c7410, ffffd0002609c960, ffffe00084f9dca0}

Probably caused by : pci.sys

Followup: MachineOwner
---------

2: kd> !irp ffffe00084f9dca0
Irp is active with 6 stacks 4 is current (= 0xffffe00084f9de48)
 No Mdl: No System Buffer: Thread 00000000:  Irp stack trace.
     cmd  flg cl Device   File     Completion-Context
 [  0, 0]   0  0 00000000 00000000 00000000-00000000

      Args: 00000000 00000000 00000000 00000000
 [  0, 0]   0  0 00000000 00000000 00000000-00000000

      Args: 00000000 00000000 00000000 00000000
 [  0, 0]   0  0 00000000 00000000 00000000-00000000

      Args: 00000000 00000000 00000000 00000000
>[ 16, 2]   0 e1 ffffe000842c7410 00000000 fffff8015a4a837c-ffffd000205ea8c0 Success Error Cancel pending
         \Driver\pci	dxgkrnl!DpiFdoPowerCompletionRoutine
      Args: 00000000 00000001 00000001 00000000
 [ 16, 2]   0 e1 ffffe000847a31f0 00000000 fffff802715201cc-ffffe0008709fea8 Success Error Cancel pending
        *** ERROR: Module load completed but symbols could not be loaded for nvlddmkm.sys
 \Driver\nvlddmkm	nt!PopRequestCompletion
      Args: 00000000 00000001 00000001 00000000
 [  0, 0]   0  0 00000000 00000000 00000000-ffffe0008709fea8

      Args: 00000000 00000000 00000000 00000000
2: kd> !sysinfo machineid
Machine ID Information [From Smbios 2.7, DMIVersion 39, Size=1687]
BiosMajorRelease = 4
BiosMinorRelease = 6
BiosVendor = American Megatrends Inc.
BiosVersion = G750JM.207
BiosReleaseDate = 07/17/2014
SystemManufacturer = ASUSTeK COMPUTER INC.
SystemProductName = G750JM
SystemFamily = G
SystemVersion = 1.0
SystemSKU = ASUS-NotebookSKU
BaseBoardManufacturer = ASUSTeK COMPUTER INC.
BaseBoardProduct = G750JM
BaseBoardVersion = 1.0
Why is \Driver\pci the issue ?
Well it’s time to rollback, like suggested here, to the OEM drivers to be sure I’m not going to have anymore issues. Version 347.52 from the 2nd of April 2014!
Damaging SATA controller
What’s great about the G750JM is that is has two 2.5″ bays, one is already populated with a 1TB hard drive (Hitachi Travelstar 7K1000). That’s a great opportunity to put another 1TB drive in the other bay so I can double my storage !
Except no. The SATA controller seems to damage hard drives put in the second bay. I got no response from Asus’ support team regarding that issue. When I RMA’d the laptop they changed the motherboard (on wich the SATA controller sits ?), I ran through 4 hard drives of the same brand as the one that came with the laptop in the second bay.
They all ended up dying. And more often than not, not even reporting S.M.A.R.T. issues. Something is wrong, and it’s not the hard drives causing issues.
So I started thinking… Maybe I’m the only one experiencing this issue. Well I’m not really the only one actually. That might not mean much.
Asus’ support
Let’s rant a bit. I have been contacting the support since 2014 I believe. I have RMA’d this computer twice and it still damages the hard drives in the second bay, it still needs to be disassembled to rewire the screen correctly sometimes. It still Blue Screens with Nvidia’s drivers.
Is this Asus quality? How come I’ve had a flawless experience on a desktop computer with Asus but on a laptop I must pull out my hair?!
I have literally emailed Asus’ support team begging them to get the laptop repaired once and for all, begging them for the quality of service I believe every single customer deserves. Even when my warranty ended.
I have tried my best to diagnose issues, I have sent videos and logs. I have asked for help and nothing was ever done to help me. Instead it was always the kind of response where I would have to send the computer back and let them evaluate if the warranty covers the damages or not before doing anything.
Am I an idiot for trying to figure out what wrong and getting a fully functional laptop?
You tell me Asus.
Conclusion
The Asus ROG G750JM is a defective by design laptop. My motherboard, GPU, screen and “SATA cables” were changed during the first RMA. I then got a screen that have some of the worst burn in you could possibly ever have and it wasn’t even securely wired, so when the cable came loose the picture would just glitch.
While I think that customers don’t have to be treated as kings, I believe that quality should be a concern. Produce the best product and service possible to your customers.
It seems that the G552VW model has kind of the same problem for the nVidia driver, I have done some support (in French) about a BSoD happening. The BSoD happened in Phantasy Star Online 2.
Installing the old drivers from the Asus’ support site resolved the instant BSoD that he would get a few seconds after loading the game. I see a pattern.
